Introduction to OS6
OS6 is Luna’s 6th generation of the Linear Asset Monitoring System.
The purpose of this document is to provide users the information required to monitor an asset using Luna OS6 software. It provides an overview of the major System functionality and explains these features and tools available to a logged in user.
Acronyms/Terminology
| Acronym | Meaning |
|---|---|
| CU | Control Unit |
| PU | Processing Unit |
| OPS | Optical Processing System |
| IU | Interrogator Unit |
| DAS | Distributed Acoustic Sensing |
| DTS | Distributed Temperature Sensing |
| TOTP | Time-based one-time password |
| 2FA | Two Factor Authentication |
| Terminology | Meaning |
|---|---|
| Control Unit | Control Unit A Windows-based PC built specifically to run the OS6 software and monitor an asset |
| Processing Unit | A server specifically to process/store the data from the Interrogator Unit |
| Interrogator Unit | An Luna proprietary product that connects to the fibre and performs Distributed Acoustic Sensing (DAS) measurements |
| Optical Processing Unit | A multi-component system comprising an Interrogator Unit and Processing Unit. |
| FBE Data | A chart displayed in real time on the Surveillance Waterfall Window. It represents the amplitude of the sound observed by each DAS location |
| Waterfall | A dynamic chart that represents live & historical data from the histogram. Location is represented along the x-axis; time is shown on the y-axis and amplitude of the signal is represented by varying colours. |
Users
There are four different user access levels:
- Light User Read-only access with limited functionality
- Standard User Ability to acknowledge/dismiss alerts
- Trained User As standard user, with area editing and area suppression privileges
- Elevated Trained User (Super User)
It is NOT possible to add, modify or delete a user who has a higher privilege level. In addition to the access level, users will need to provide a name and a password. This password must pass OS6's password complexity requirements.
Super Users
Trained Users may login with Super User privileges via the TOTP process. Super Users have advanced configuration access such as the ability to setup of detectors and to make system architecture changes. This privileged access times out after 7 days.
Unique Login Recommendation
All users should have their own unique account and not use “generic” logins as this circumvents the auditing process.
User Settings
Each user can setup their own display ‘settings’ such as language, units, look and feel. These settings can either be applied independently to a single user, or shared between all users.
User Profiles
In addition to User Settings, users can save other non 'User Settings' in User Profiles. A user profile will remember the state of each display opened in OS6, it's position/size on the screen, and for some displays, any display configuration options.
Map Overview
Opened when a user authenticates their details. This display gives an overview of the system by:
- Showing the Customer fibre/asset routes
- Highlighting alerts along the fibre/asset routes
- Highlighting system health information
- Providing access to all other features/displays
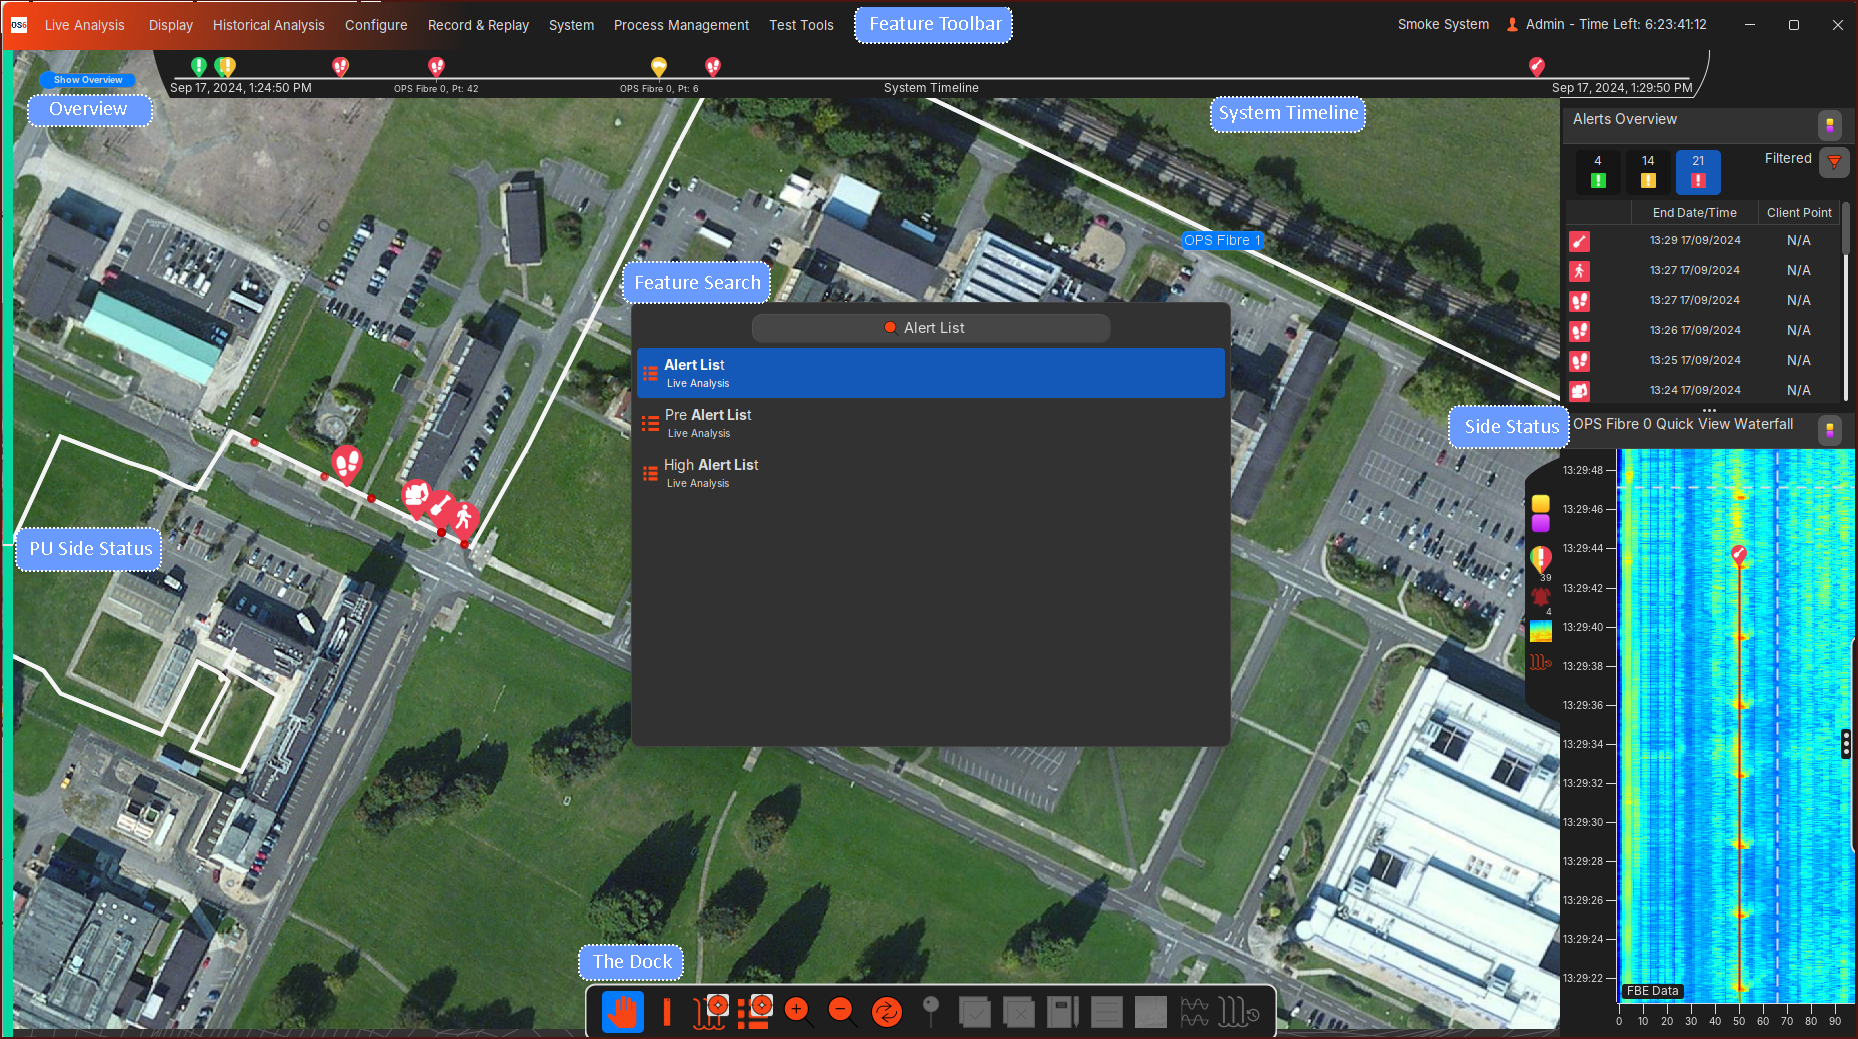
Feature Search/Feature Toolbar
All OS6 features and options can be found under the Feature Search or Feature Toolbar.
The quickest way to access any feature/window is to use the keyboard. Simply start typing the content you are looking for (e.g. waterfall) and the relevant options will pop up. To find the same content without using the keyboard, users can instead use the Ribbon Toolbar, where content is categorized under relevant menu headings.
Side Status
Alert Lists, Waterfalls (Live/Historical), User Notifications can be overlayed on the Map Overview as single display, or split between two displays.
System Timeline
Events generated by the system or events generated by a user's action is shown on the Timeline. All events can be historically viewed in Auditing.
PU Side Status
Highlights the status of OS6 applications on each PU. Green indicates the applications on the PU are operating as expected. Red indicates there is an issue with the application(s) on the PU and Grey indicates that the applications on the PU have been turned off.
The Dock (Map Overview)
A tool users can use to interact with map content. Such content includes zooming and alerts.
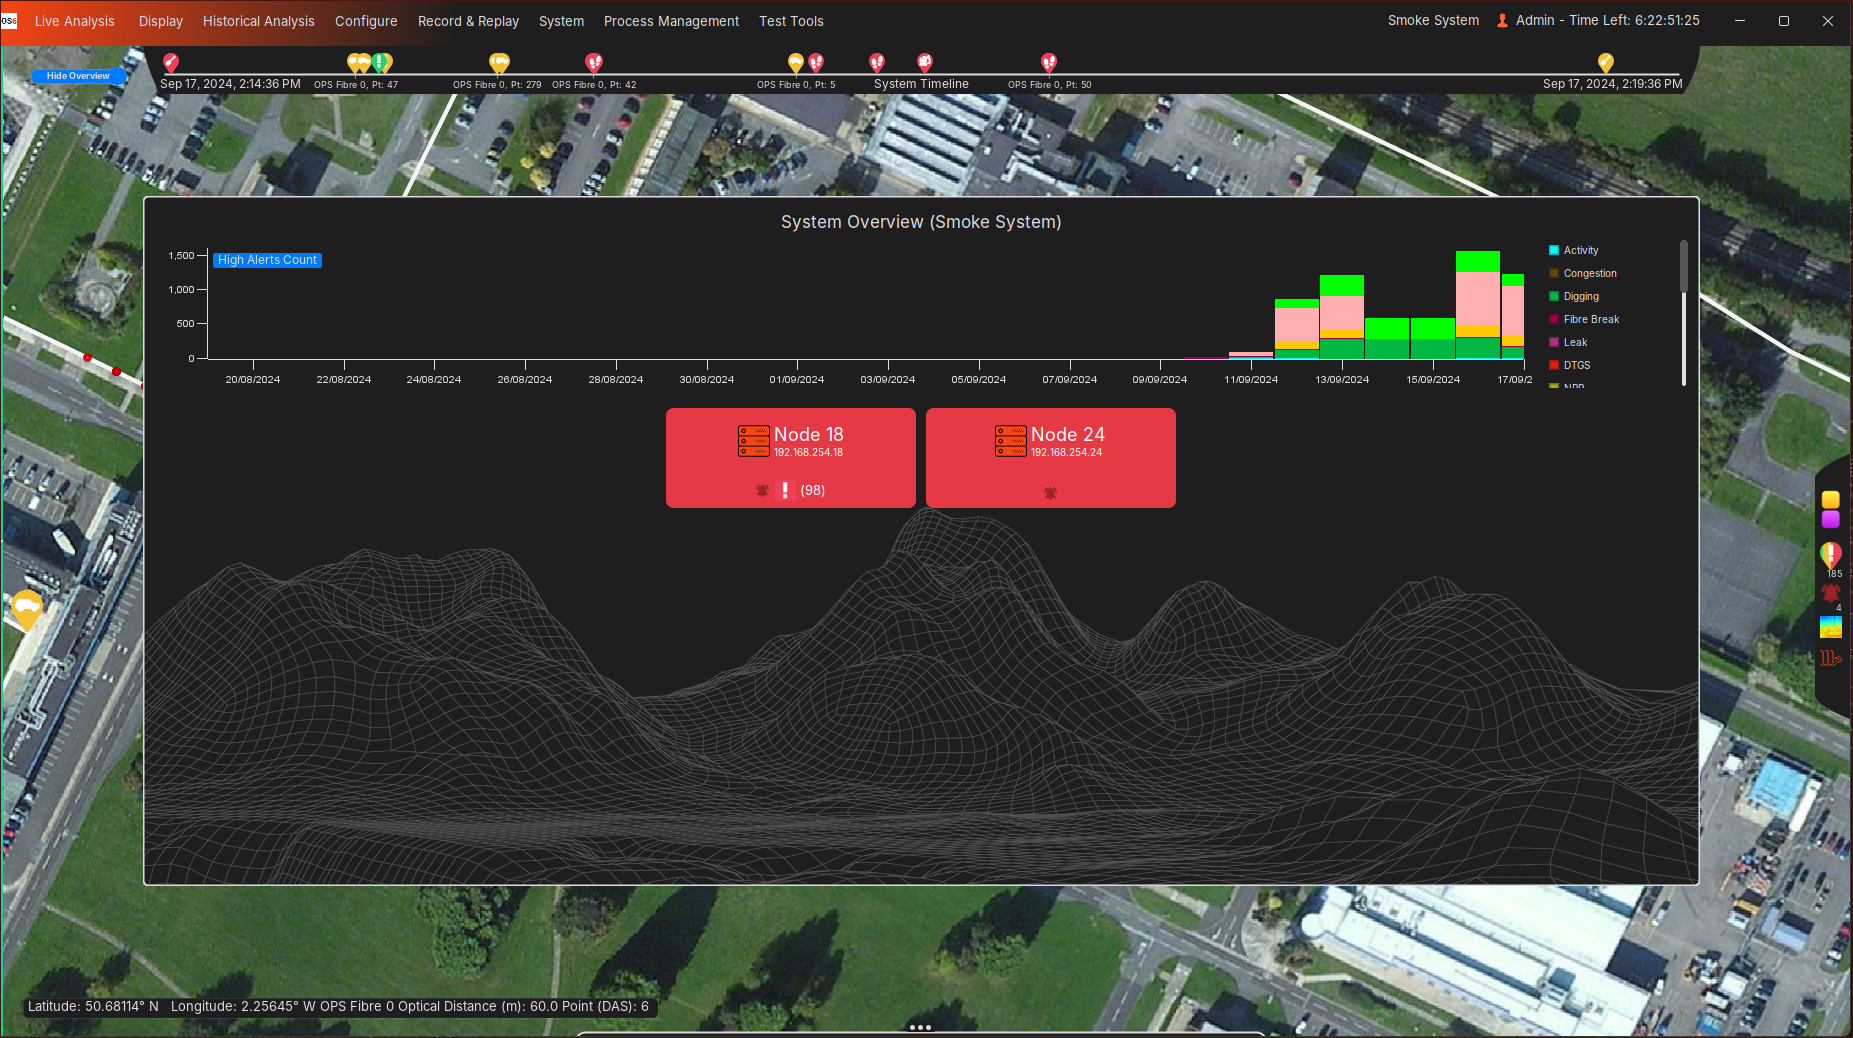
Overview
Provides a high level alert and health status for the entire system.
- Number of total high alerts per day, per type, seen over 30 days
- Combined application and User Notification health status per PU
Alerts
Live Alerts
Detection and Output
OS6 has a suite of algorithms to detect, classify and locate a variety of events.
Once an activity has been detected, localised and classified, an OS6 alert will be created. The details of this alert (time, location, importance/level, type etc.) will be filled out by the algorithm producing the alert. The algorithm will continue producing updates to the same alert while it continues to associate relevant activity.
OS6 can also receive DTS events through Charon4 which are converted into OS6 alerts. These alerts will behave in the same way and contain the same detail as any alert produced by an OS6 algorithm.
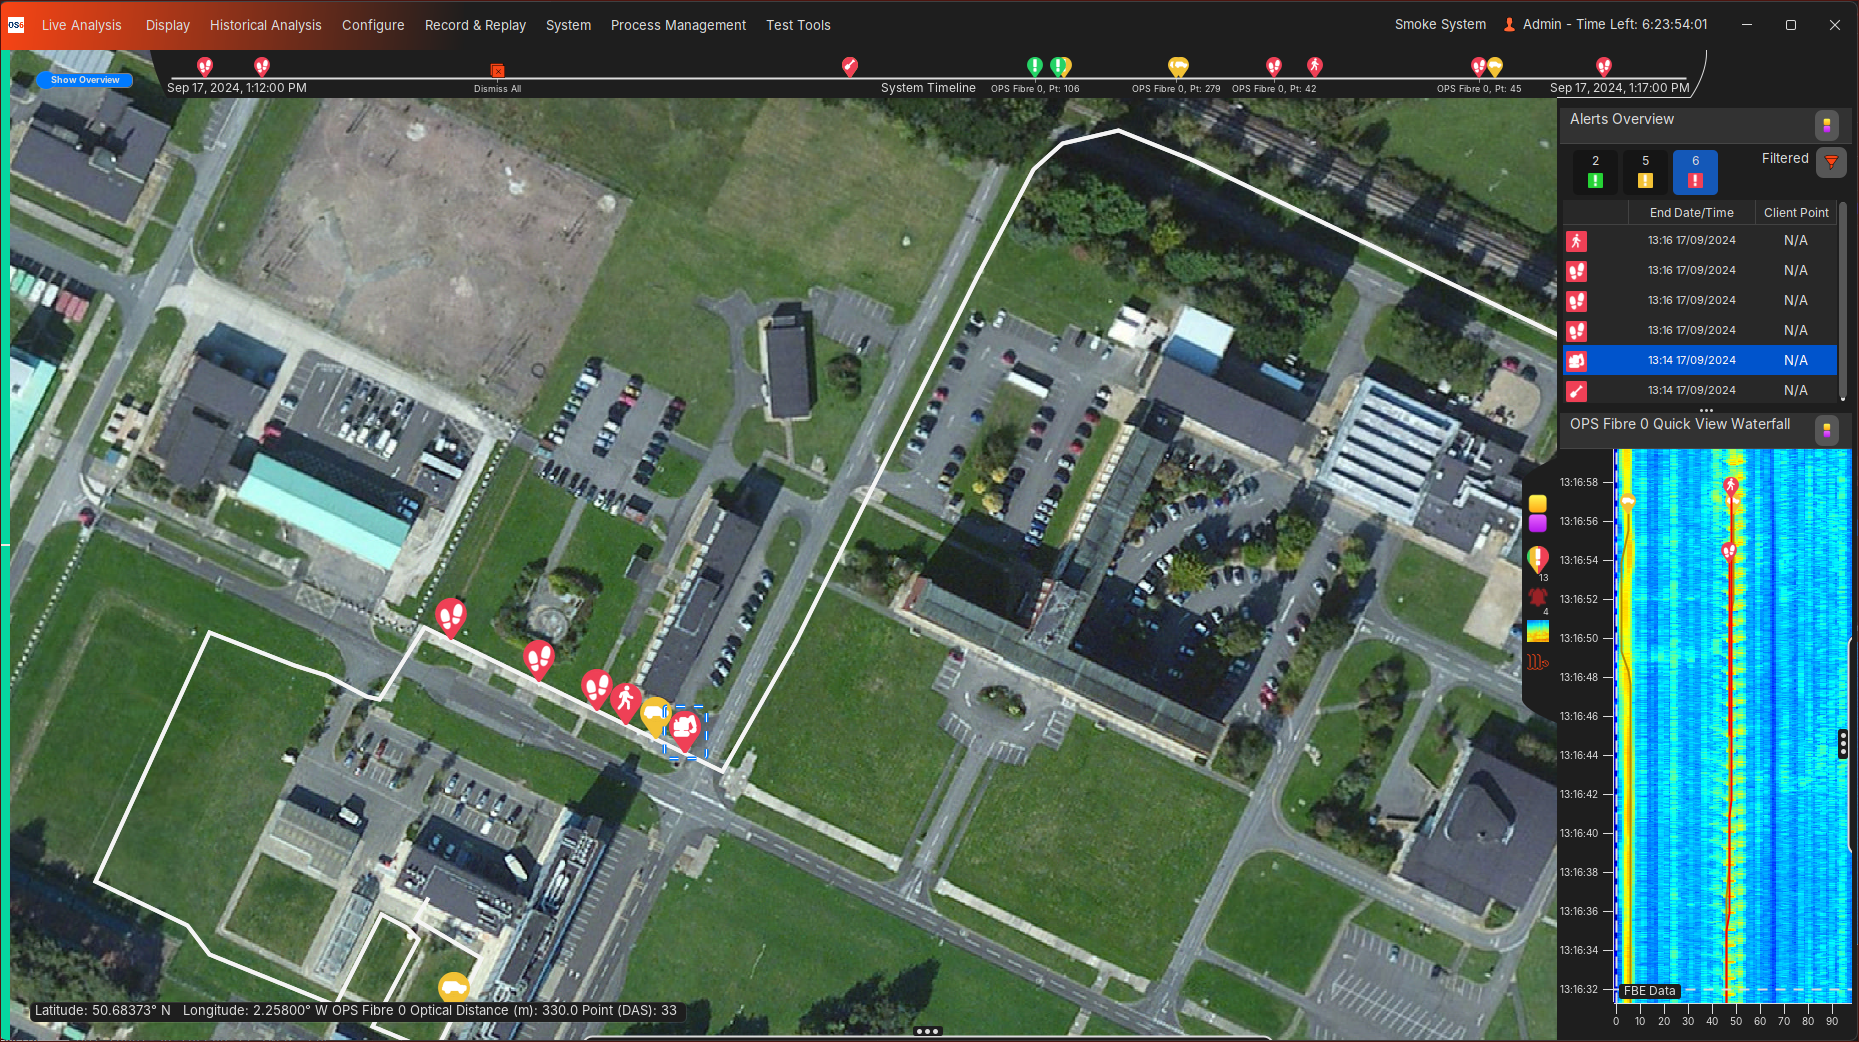
All alerts will be drawn along fibres on the Map Overview, and displayed in Alert Lists as seen below:
Opened waterfall displays will also track alerts while they continue to update:
![]()
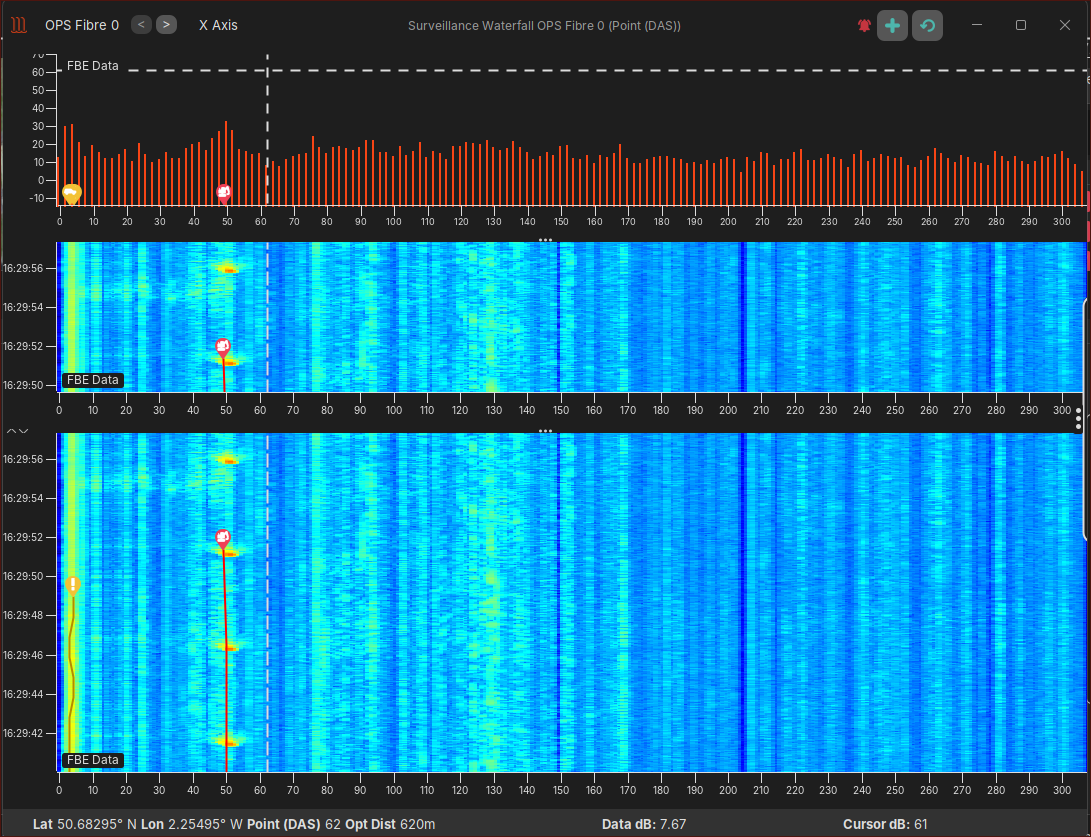
Live Waterfall
To help users determine if an alert is genuine, the Live Waterfall can be used. This tool will visualize the activity (FBE Data as standard) per fibre and thus aid the user in understanding the context of any activity/alerts being produced:
- Does the activity look like any created alert?
- Did this activity occur previously at this location?
- What other activities are occurring in the area?
- For example walking, just before the Digging alert was created
Other data types including DTS Data (if configured) and Algorithm Data can also be visualised on this Live Waterfall.
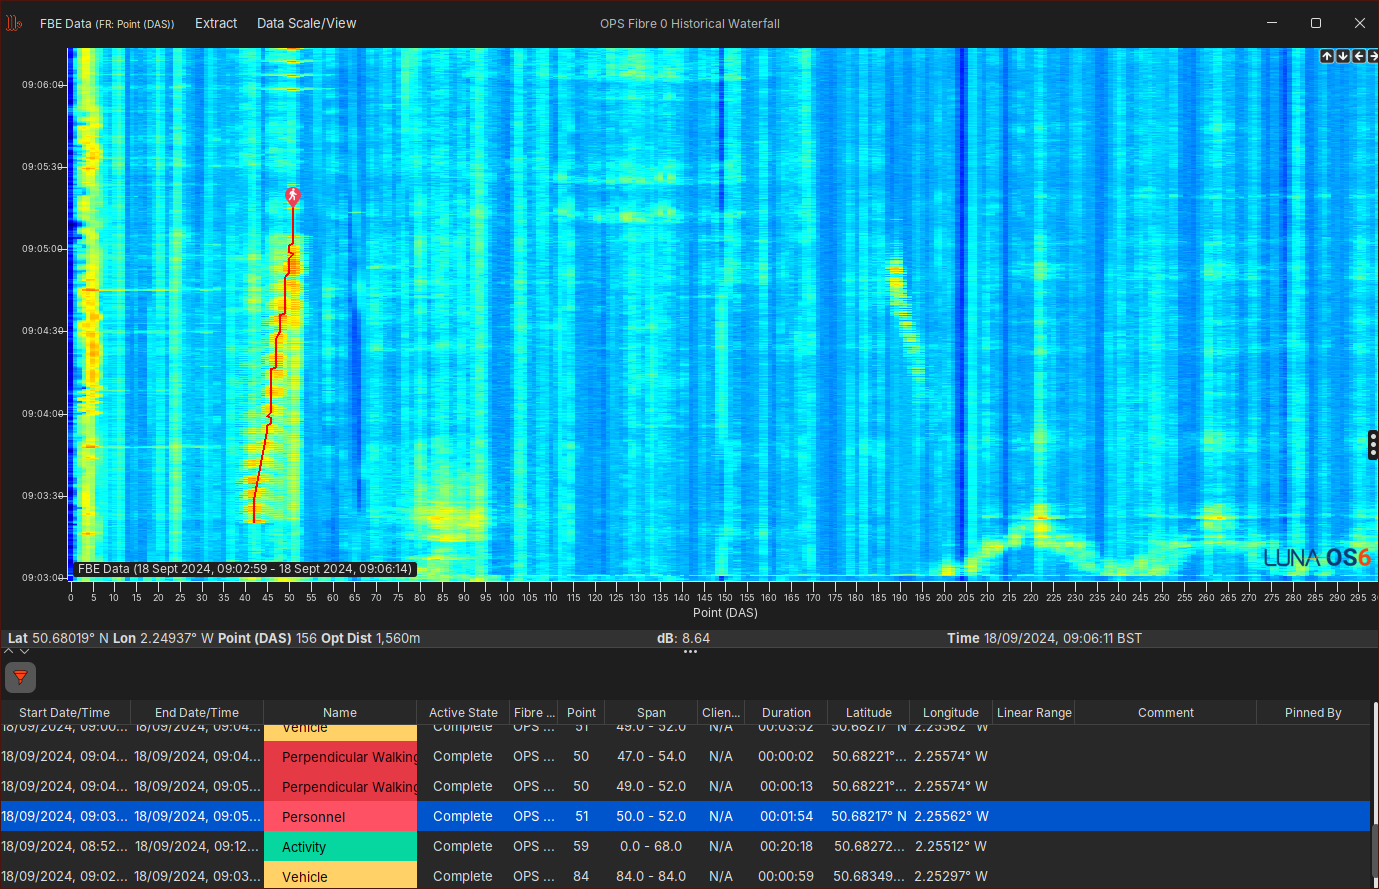
Historical Waterfall
All the data seen in the Live Waterfall is stored on disk through OS6's Rolling Recorders, and can be viewed at a later date (provided the data is still available on disk) on the Historical Analysis/Waterfall displays.
Alert User Actions
The user can perform a number of actions on alerts. This includes:
- Commenting
- Pinning
- This action places the alert at the top of any Alert List along with a highlight to indicate its pinned
- Focus
- Opened displays (Map Overview, Waterfalls) will highlight and centre on the alert
- An option will be provided to open a focused Live Waterfall if there is not one already open
- Updates & Auditing
- Views all the changes the algorithm and users made to the alert
- Historical Analysis
- View historical time series data (Waterfall FBE Data etc.), centred around the location and time of the alert
- Acknowledgement
- Normally used to indicate an alert is being actively dealt with. An acknowledgement will remove the importance/level colour indicator on any alert list, and some interfaces may also remove the alert.
- Dismissal
- A dismissal will remove the alert from the Map Overview, Alert Lists, Live Waterfalls, and other displays that deal with live alerts.
- Only once the alert has been dealt with in the correct manor should an alert be dismissed.
These actions can be found on right click menus on the Alert Lists, or via options in 'The Dock'. Alert user actions are audited.
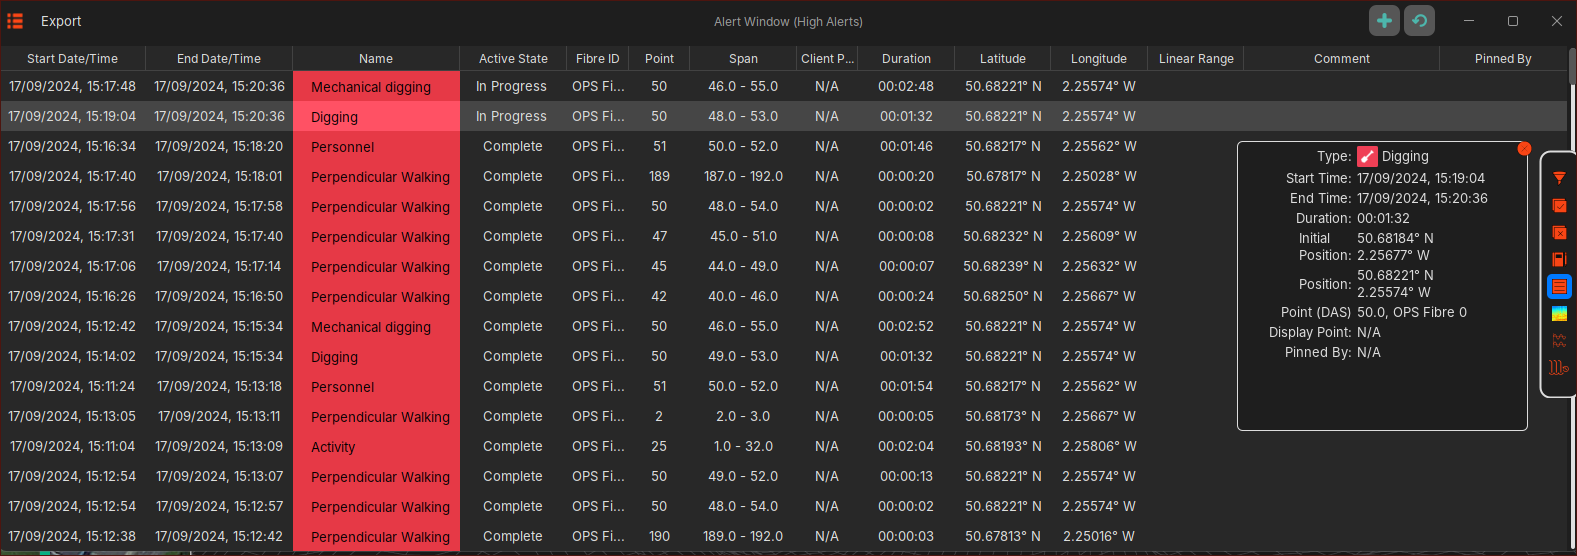
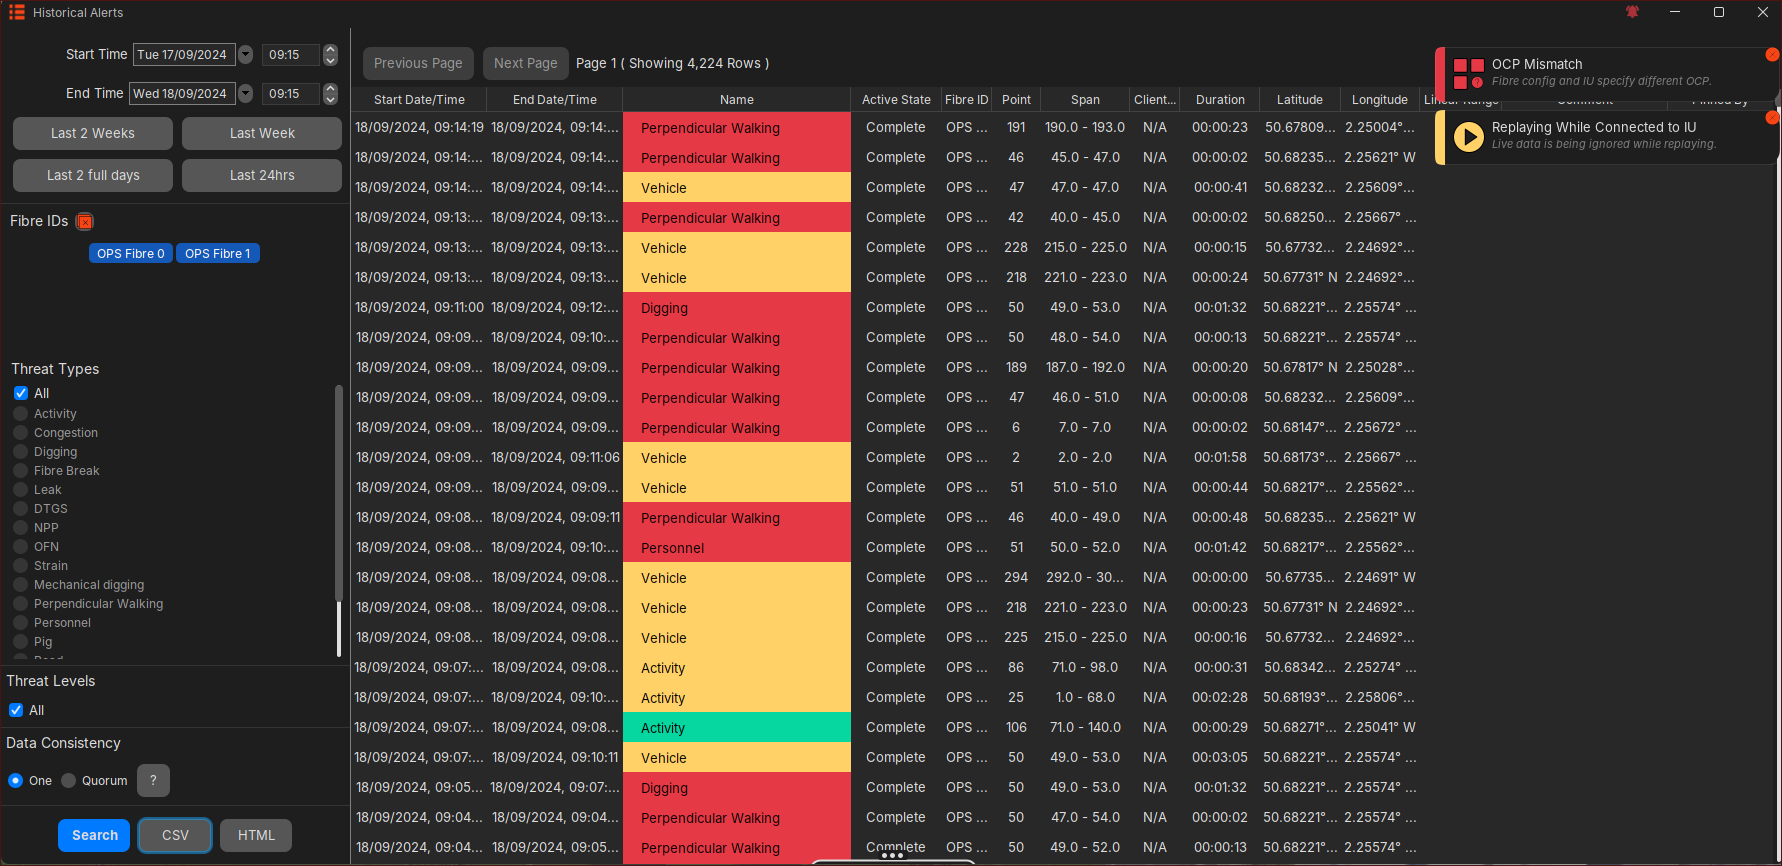
Historical Alerts
A number of tools allow the user to search and analyse historical alerts. An 'Historical Alert' is classed as an alert that is no longer being updated and has 'Completed' (This 'Completed' status will be visible on Alert Lists).
Historical Alert List
Once an alert has 'Completed', it will be available in the 'Historical Alerts' analysis tool. Users are able to look up all historical alerts of the system using a time range, fibre(s) and alert type search options. Users are able to extract this historical alert data to CSV or HTML format. Limited 'Alert User Actions' via right click menus or the Dock is also available on this display.
Alert Filtering
Each GUI can be setup to display specific alert types, alert levels and fibres. This configuration is unique to each GUI connected to the system will be remembered upon GUI start-up.
On-top of the GUI filtering, users can also apply additional alert filtering on the Alert Lists (Live & Historical). This additional filtering is not persisted and will be lost upon GUI restart or the Alert List being closed.
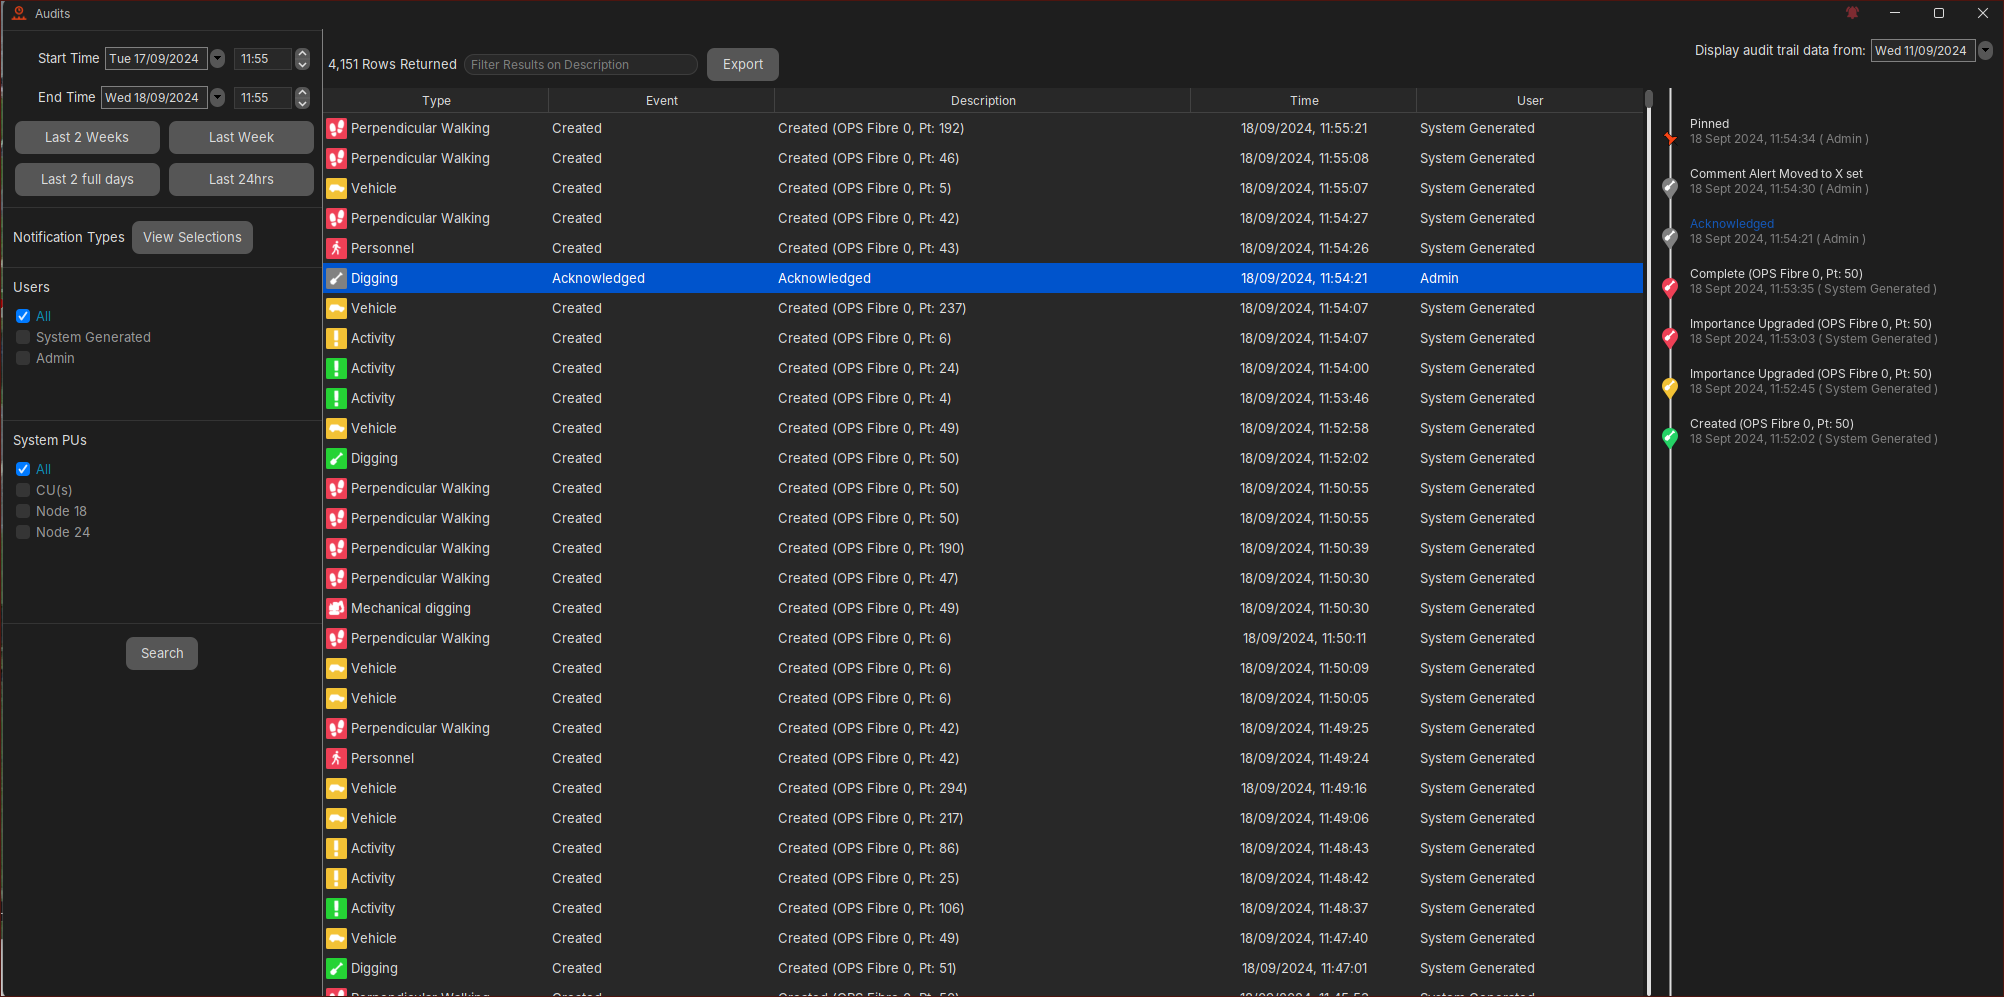
Auditing
Auditing activities can also be interrogated with detailed information supported on each entry. OS6 offers ‘System’ auditing as well ‘User’ auditing against named accounts for forensic analysis purposes. Events seen on the Live Timeline (seen above) will be viewable in Auditing.
Auditing Features
The auditing tool allows various search and export functions to aid forensic analysis. These include:
- Detector changes
- System/Process changes
- Alert Lifecycle changes (comments, acknowledgement etc)
- User Account changes (login, changes to an account, account deletion)
- Suppression Changes
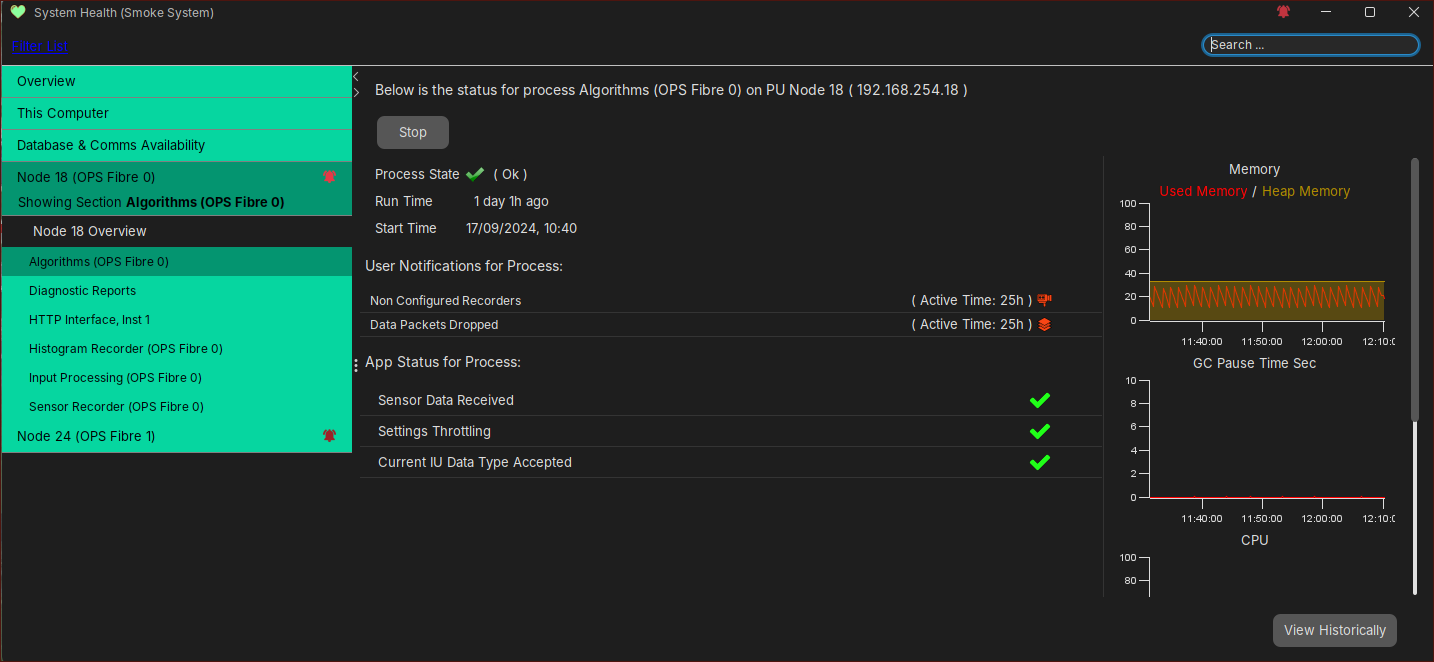
Health
Application Status
A PU contains a number of OS6 applications/processes that handles the IU processing for that PU. Some PUs may also contain other processing that handles the forwarding of OS6 data over Interfaces like REST or Modbus etc. Each application will report its status using a colour indicator:
- Green indicates the application is operating as expected
- Red indicates there is an issue with the application
- Grey indicates that the application has been switched off
Users can drill down on each application per PU to understand why the application is issuing a particular colour.
To view the Application Status, this can be found on the PU Side Status (Map Overview), the Overview (Map Overview) and the System Health display as seen below:
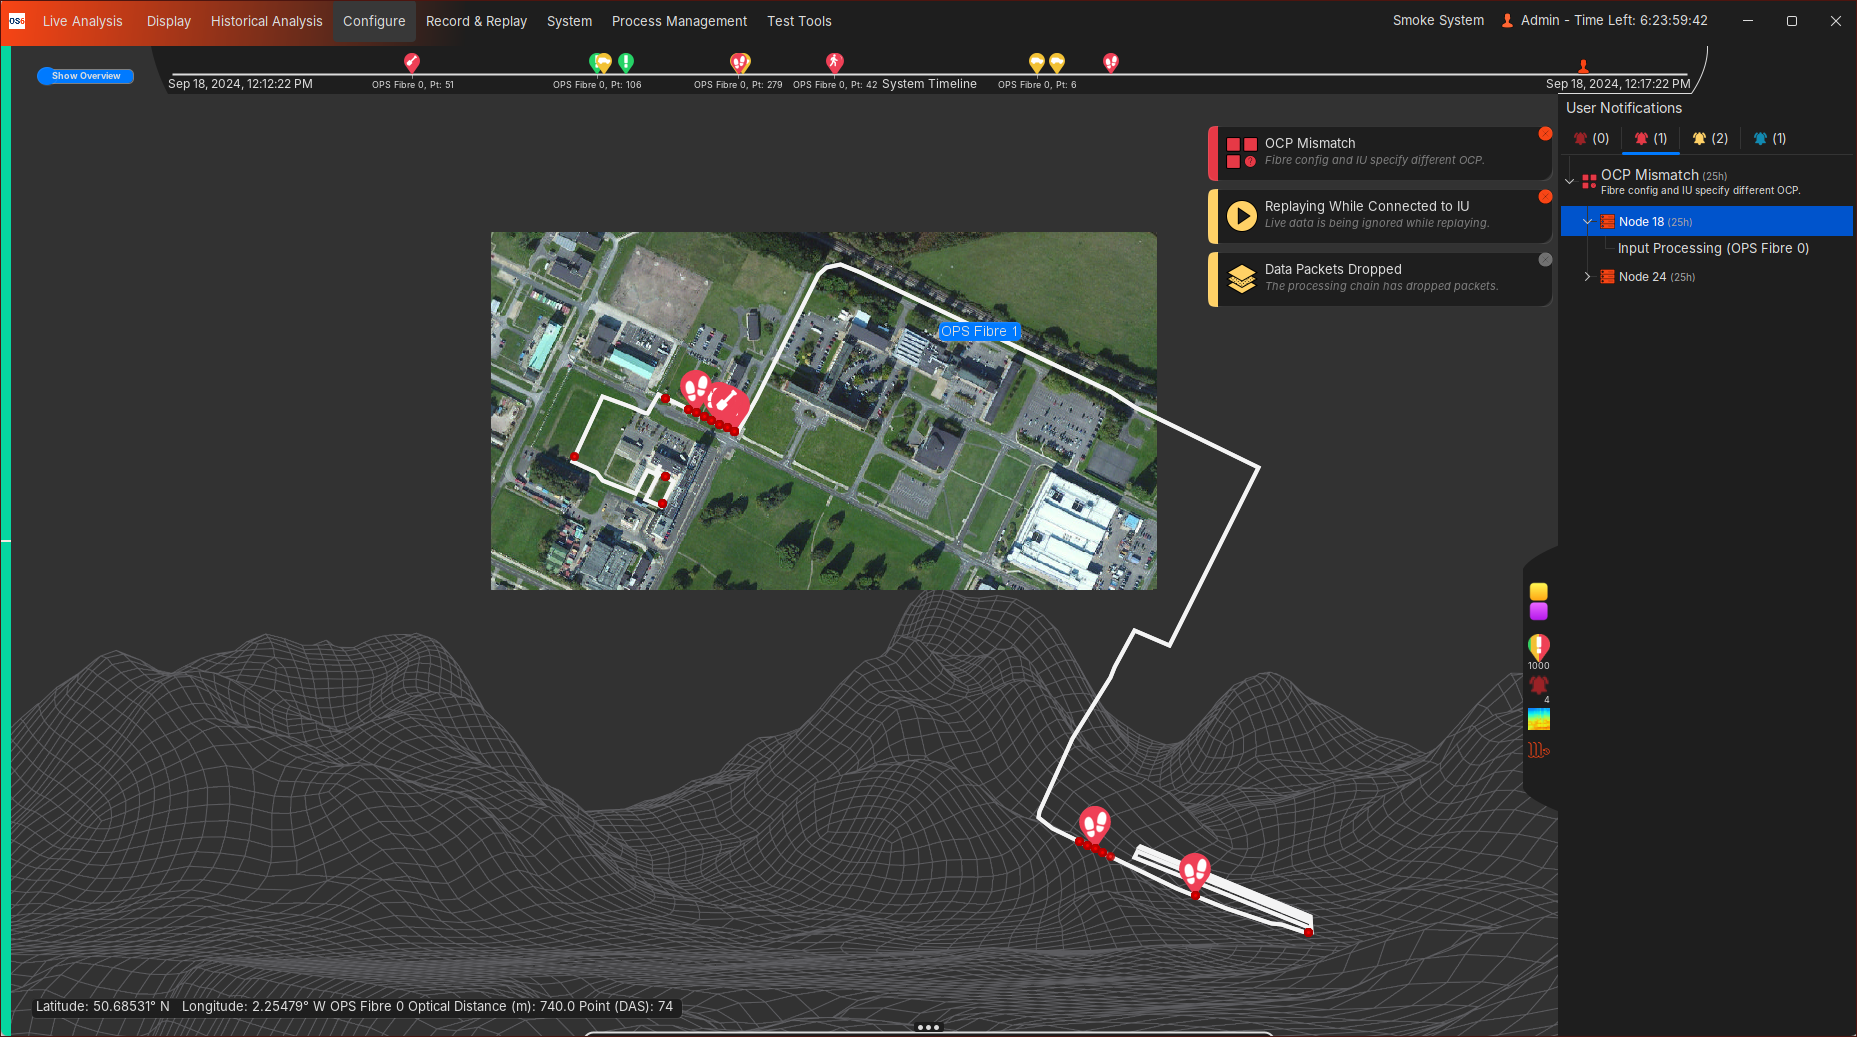
User Notifications
A User Notification is created when the user needs to be aware of a particular state the system is in. These notifications can range from informative to time-critical errors where immediate action is required. Some User Notifications will be driven off the Application Status, whereas some are generated independently.
These User Notifications will be shown as popups on all relevant displays and the Map Overview, with a more detailed breakdown of any User Notification available on the System Health display or Side Status (Map Overview).
Overall System Health
For a system to operate as expected, users MUST monitor both the Application Status and User Notifications and deal with any issue promptly.
Contact Information
Contact our team of technical experts for further support and enquiries: